Density of Relaxed Ti5O10(+14)
The structure of SrTiO3 has alternating layer of TiO2 and SrO. Auger electron spectroscopy
analyses indicate that the TiO2 plane constitutes most of the top layer of vacuum fractured SrTiO3
sample. Ultraviolet photoemission spectroscopy studies show that the electronic properties of SrTiO3
(100) are strongly influenced by oxygen vacancies on the surface TiO2 plane. STM studies of
SrTiO3 (100) (annealed at high temperatures) in ultrahigh vacuum (UHV) led to atomic scale
resolution images with √5x√5 superstructures. The bright spots of these images were suggested to
correspond to the oxygen vacancies.
With the unoccupied band levels lying between ef and ef + Δ, the ρ (r0, ef) plot can be calculated as a function of the tip-sample distance r0. The ρ (r0, ef) plot calculated for r0 = 3 Å shows a bright spot centered at each oxygen vacancy site. This is in good agreement with experiment and therefore supports Tanaka et al.’s interpretation that the bright spots of the STM images of SrTiO3 (100) correspond to the oxygen vacancy sites of the surface. As the r0 value decreases from 3 Å, the bright spot splits into two (Figure for r0 = 1 Å). All these findings reflect the fact that, in the relaxed Ti5O1410- layer, the band levels lying between ef and ef + Δ have contributions from the hybrid orbitals of the two Ti3+ sites flanking each oxygen vacancy.
With the unoccupied band levels lying between ef and ef + Δ, the ρ (r0, ef) plot can be calculated as a function of the tip-sample distance r0. The ρ (r0, ef) plot calculated for r0 = 3 Å shows a bright spot centered at each oxygen vacancy site. This is in good agreement with experiment and therefore supports Tanaka et al.’s interpretation that the bright spots of the STM images of SrTiO3 (100) correspond to the oxygen vacancy sites of the surface. As the r0 value decreases from 3 Å, the bright spot splits into two (Figure for r0 = 1 Å). All these findings reflect the fact that, in the relaxed Ti5O1410- layer, the band levels lying between ef and ef + Δ have contributions from the hybrid orbitals of the two Ti
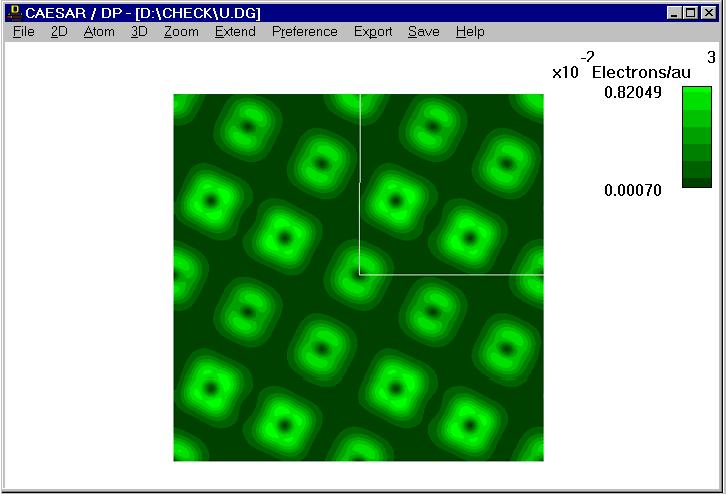
Figure. ρ (r0, ef) plot calculated for the relaxed Ti5O1014- at r0 = 1.0 Å. The contrast covers electron density variations in the 0.0 - 2.3x10⁻³ electrons/au range.
Go back to The Gallery